Remote Team Communication: Why Diagrams Beat Endless Slack Messages

Remote Team Communication: Why Diagrams Beat Endless Slack Messages
Let me paint you a picture: It's Tuesday afternoon. You're trying to understand a project update. There are 47 unread Slack messages across 3 different threads, 5 conflicting opinions, and you're more confused now than when you started.
Sound familiar?
Welcome to remote work communication hell. The good news? There's a shockingly simple solution most teams completely overlook.
The Remote Communication Problem Nobody Talks About
When teams work in the same office, miscommunication is annoying. When teams work remotely, it's devastating.
Why remote makes everything harder:
- No body language to read
- No whiteboard to sketch ideas
- Time zones mean async conversations
- Written text misses tone and nuance
- Important details get buried in threads
I watched a 3-person project team exchange 200+ messages over 4 days trying to align on a simple workflow. 200 messages!
Then someone created a simple flowchart. Everyone understood it in 30 seconds. Problem solved.
The Visual Communication Superpower
Here's what I've learned managing remote teams for 5 years:
One diagram replaces approximately 1,000 words of explanation.
Not exaggerating. A good diagram communicates:
- What needs to happen
- Who does what
- The sequence and dependencies
- Decision points
- Expected outcomes
All at once. In one glance.
Real Story: The $50K Misunderstanding
A friend's company spent 3 weeks building the wrong feature because of miscommunication.
What happened:
- Product manager described feature in a document
- Developer read it differently
- Weekly check-ins seemed aligned (but weren't)
- By the time they realized... 3 weeks wasted
Cost: Roughly $50,000 in salary and missed opportunity.
Solution: Now they start every feature with a simple user flow diagram. Takes 10 minutes to create. Saves weeks of confusion.
The 5 Diagrams Every Remote Team Needs
1. The Process Flowchart
Use for: How work gets done, approval workflows, customer journeys
Why it works: Everyone can see the same process. No more "I thought you were handling that!"
Example: Content approval process
- Writer drafts → Manager reviews → Designer creates graphics → Final approval → Publish
- Add decision points for revisions
- Now everyone knows exactly where work is stuck
2. The Responsibility Matrix (RACI)
Use for: Clarifying who does what on projects
Why it works: Eliminates "I thought Bob was doing that" situations
Visual format: Simple grid showing tasks vs. team members
- R = Responsible (does the work)
- A = Accountable (makes decisions)
- C = Consulted (gives input)
- I = Informed (kept in loop)
3. The Timeline/Gantt Chart
Use for: Project schedules, sprint planning, launch roadmaps
Why it works: Time zones don't matter when everyone can see deadlines visually
Pro tip: Color-code by department or priority. Makes it scannable.
4. The Mind Map for Brainstorming
Use for: Strategy sessions, problem-solving, creative ideation
Why it works: Async brainstorming actually works with visual boards. Everyone adds to the same map.
Tool tip: Use a digital whiteboard where team members across time zones can all contribute.
5. The Architecture/System Diagram
Use for: Tech stacks, integrations, data flows, organizational structures
Why it works: The big picture in one place. Perfect for onboarding or system changes.
How to Shift Your Team to Visual Communication
Step 1: Start With One Meeting Next time you need to explain something complex, create a simple diagram first. Share it in the meeting. Watch how much faster people understand.
Step 2: Make It a Template Did that diagram work well? Save it as a template for similar situations. Suddenly, repetitive explanations become instant clarity.
Step 3: Encourage Others When someone sends a confusing text explanation, reply: "Could you sketch that out? Would help me visualize it."
You're not being difficult-you're asking for better communication.
Step 4: Build a Diagram Library Keep all your team diagrams in one place:
- Process flows
- System architectures
- Project timelines
- Organizational charts
New team members can get up to speed without asking 100 questions.
The "Visual First" Communication Rule
Here's the rule that changed my team's productivity:
For any explanation longer than 2 paragraphs → create a diagram instead.
It feels like extra work at first. But you save SO much time in:
- Fewer clarifying questions
- Faster understanding
- Less rework from misunderstandings
- Better documentation
The 10 minutes you spend creating a diagram saves hours of confusion.
Common Objections (And Why They're Wrong)
"I'm not good at making diagrams"
You don't need to be! Tools like AutoDiagram let you just describe what you need and AI creates it. Zero design skills required.
"It takes too long"
Compared to what? The 47-message Slack thread? The meeting to clarify the meeting? The rework because someone misunderstood?
"My team won't use them"
Lead by example. Start using them yourself. When people see how much clearer your communication is, they'll follow.
"We need detailed documentation, not pictures"
Diagrams ARE documentation! Better documentation, actually, because people will actually look at them.
Tools That Make Visual Communication Easy
For Quick Sketches:
- AutoDiagram (describe what you need, AI creates it)
- Excalidraw (simple drawings, great for async)
- Miro or Mural (team whiteboards)
For Professional Diagrams:
- AutoDiagram (again, because it's that good)
- Lucidchart (if you want manual control)
- Figma (if your team already uses it)
For Annotations:
- Screenshots + arrows and text
- Loom videos where you draw on screen
- Simple slides with one diagram per slide
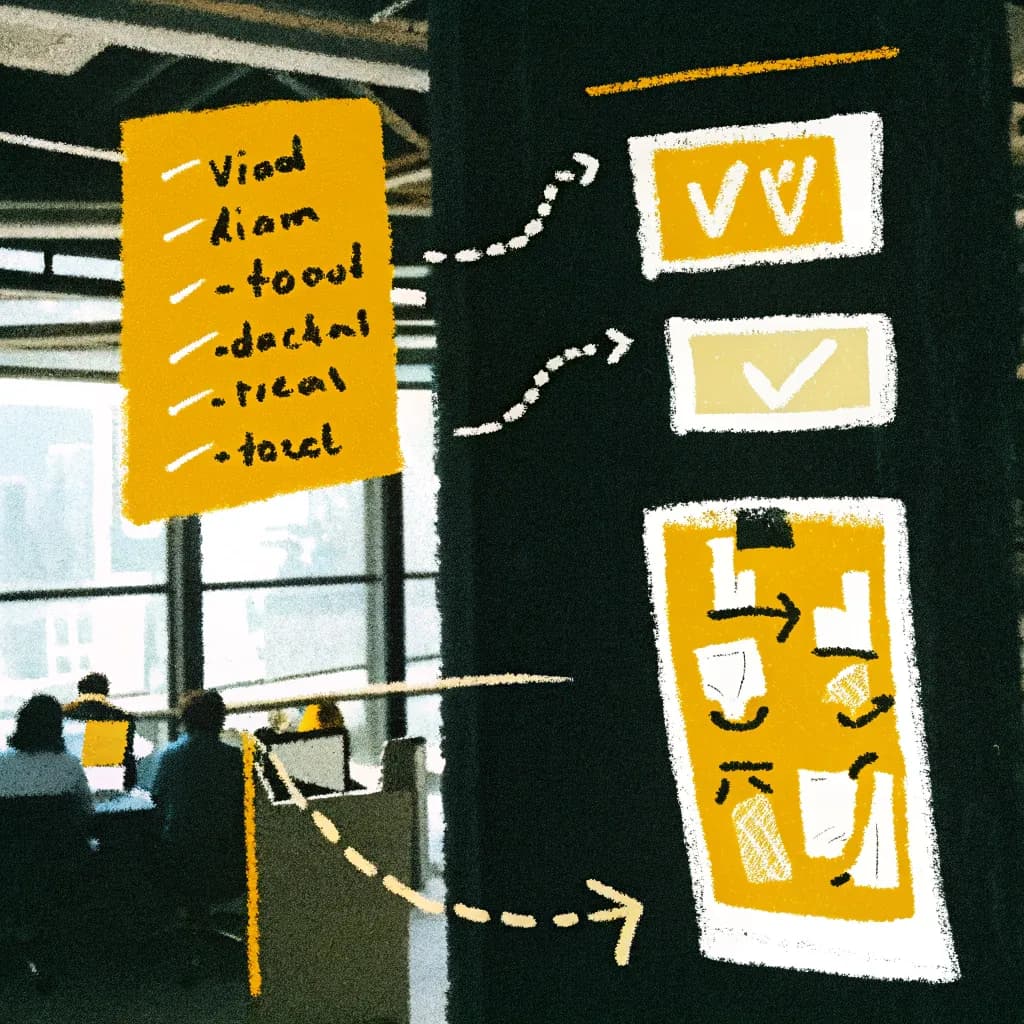
The Weekly Visual Update Format
Instead of status report emails nobody reads, try this:
Monday Team Update (1 visual image):
- Last week's completions (checkmarks)
- This week's priorities (highlighted)
- Blockers or needs (red flags)
- Timeline progress (simple progress bar)
One glance tells the whole story. Everyone stays aligned without reading paragraphs of updates.
Case Study: Customer Support Team
A customer support team was drowning in confusion about escalation processes. Different agents handled things differently. Customers got inconsistent service.
Solution: Created one simple decision flowchart:
- Issue type → Who handles it → Resolution steps → When to escalate
Results:
- 60% reduction in "how do I handle this?" questions
- 35% faster resolution times
- Training new agents went from 2 weeks to 3 days
- Customer satisfaction up 28%
One diagram. Multiple massive improvements.
The "Diagram Before Meeting" Rule
Want better meetings? Try this:
Before every meeting, share a visual showing:
- What we're discussing (agenda visual)
- Current state vs. desired state (comparison diagram)
- Options we're considering (decision tree)
Result: Meetings are 50% shorter because everyone arrives already understanding the context.
Visual Communication for Different Team Functions
Engineering Teams
- System architecture diagrams
- Data flow charts
- Sprint boards (Kanban-style)
- Bug triage workflows
Marketing Teams
- Campaign timelines
- Content calendars (visual)
- Customer journey maps
- Funnel visualizations
Sales Teams
- Sales process flowcharts
- Pipeline visualizations
- Territory maps
- Org charts for accounts
Operations Teams
- Process optimization diagrams
- Supply chain flows
- Scheduling boards
- Incident response playbooks
The Power of the "Living Diagram"
Here's an advanced technique:
Instead of static diagrams, create "living" ones that your team updates together:
- Project board that shows real-time status
- Architecture diagram that evolves with the system
- Process flow that gets refined as you learn
These become your single source of truth. No more "wait, is this document current?"
Your Challenge This Week
Pick one recurring communication challenge in your team:
- A process people always ask about
- A project where people get confused
- A workflow that needs explaining repeatedly
Create ONE simple diagram that addresses it. Share it. Update it based on feedback.
I bet you'll cut related questions in half within a week.
Ready to transform your remote team communication? Try AutoDiagram to create clear, professional diagrams in seconds-no design skills needed → Start Communicating Visually
Quick FAQ
Q: What if my team is resistant to new tools?
A: Don't make them use tools-just share diagrams as images in your existing channels (Slack, email, etc.).
Q: How do I keep diagrams up to date?
A: Assign an owner to each critical diagram. Review quarterly. Delete outdated ones.
Q: Can this work for very technical teams?
A: Especially for technical teams! Engineers love precise visual documentation.